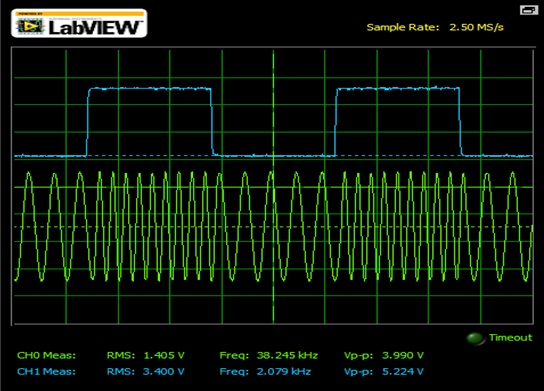
Observe the frequency change in the FM wave. Calculate f max & f min of the frequency modulated wave.
f max = 37.8 kHz & f min = 21.1 kHz.
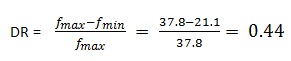
Deviation Ratio ( DR ) can be calculated as,
The % deviation ratio is 44 %.
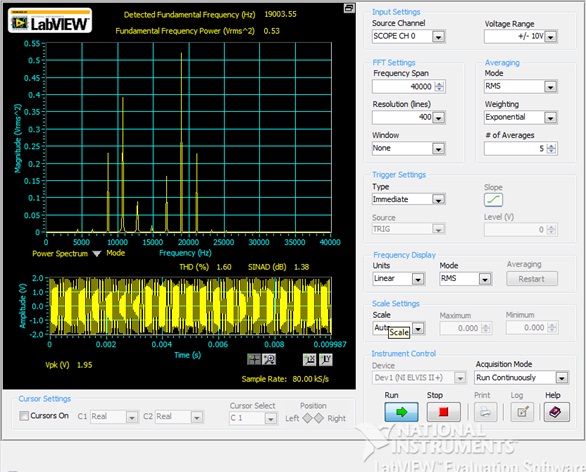
Fig.2 Frequency Spectrum of FM Signal.
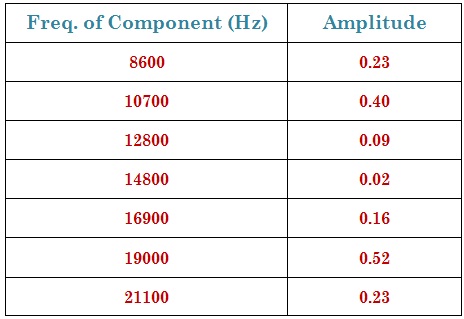
The dominant frequency components which are present in the Fig.2 Frequency Spectrum are tabulated below in Table.1
Table.1 Dominant Frequency Components with Magnitude.
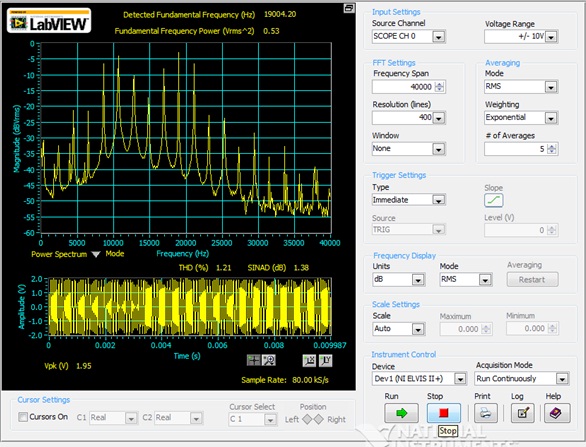
Fig.3 Power Spectrum of FM wave.
From the Fig.3 , it is seen that the spectrum has WBFM being generated from the VCO. The THD ( Total Harmonic Distortion ) in percentage is 1.21 & Signal to noise ratio ( in dB ) is 1.38.