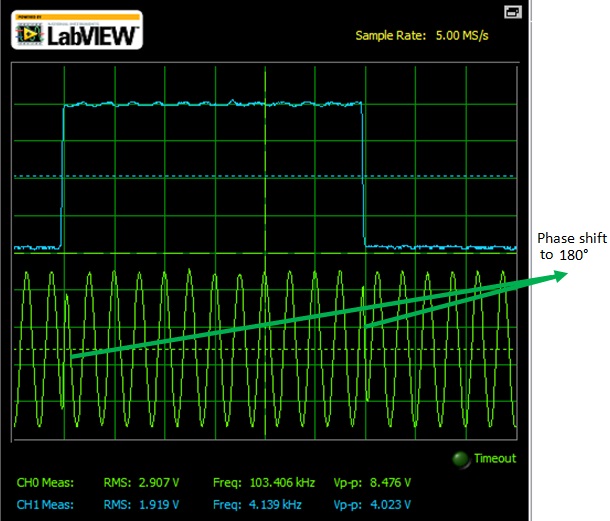
In this Fig.1, the Binary wave is generated as you can see that the phase changes with every logic transition from 1 to 0 & from 0 to 1.
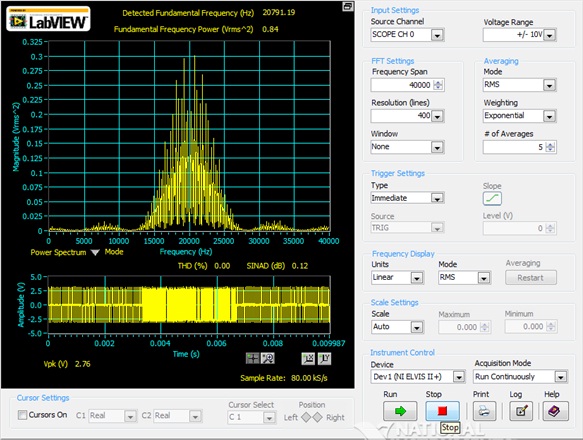
Fig.2 Frequency Spectrum of BPSK generation.
The frequency spectrum of BPSK signal generation has THD (Total Harmonic Distortion) as 0 % & SINAD is 0.12 dB.
The fundamental detected frequency is at 20791.19Hz & the corresponding Power is0.84.
The spectrum has a peak at the 20 kHz. It also has peaks at regular intervals frequencies higher than the carrier frequency. There were no peaks at frequencies lower than the carrier frequency.
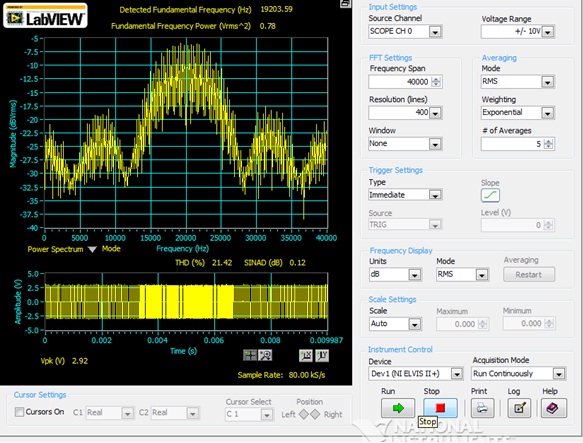
Fig.3 Power Spectrum of BPSK Signal.
The Power Spectrum has its THD as 21.42% & a SINAD is 0.12 dB. The detected fundamental frequency is at 19203.59 Hz & the corresponding power is 0.78.
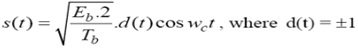
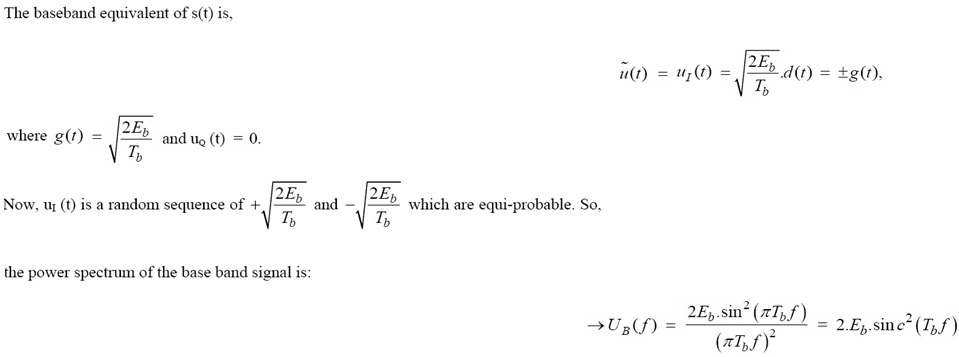
Continuing with our simplifying assumption of zero initial phase of the carrier and with no pulse shaping filtering, we can express a BPSK modulated signal as: