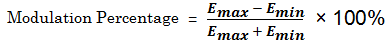
This is called time domain representation of AM signal.
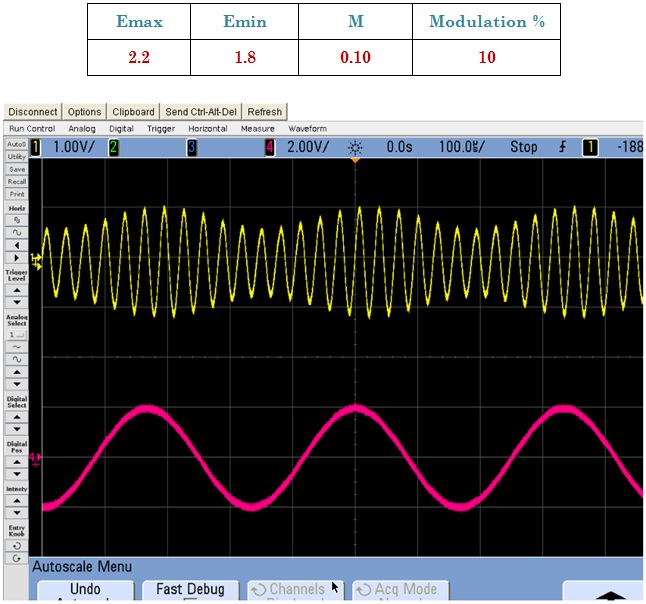
Fig.1 Showing the Emax & Emin.
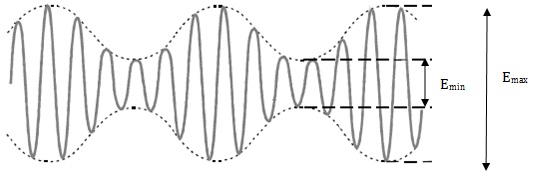
Observations
Fig.2 Output of the Amplitude Modulation.
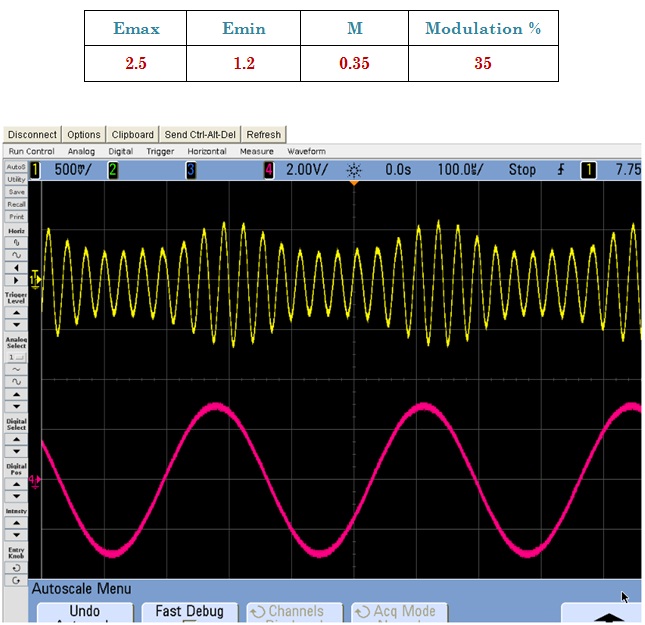
There are some other Figures shown, in which the Modulation index are different which will help you in better understanding of how to take Emax & Emin values from the experiment.
Fig.3 AM modulated wave with modulation index of 50%.
Fig.4 AM modulated wave with modulation index of 10%.
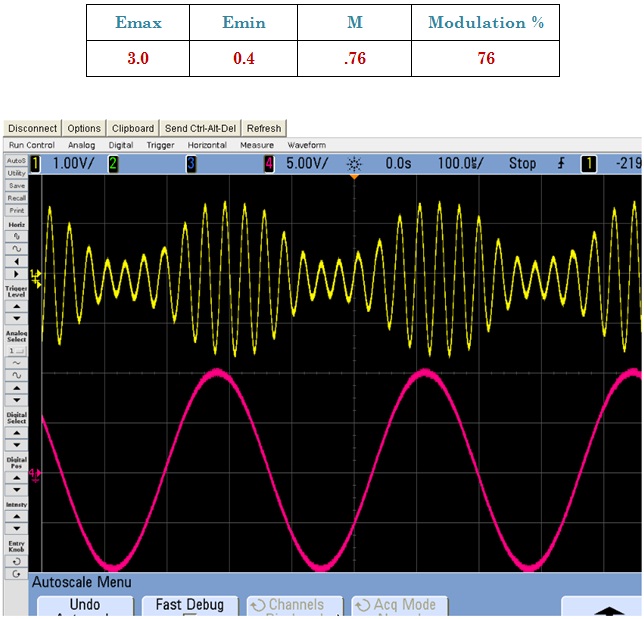
Fig.5 AM modulated wave with modulation index of 76%.