2nd Order Band Reject Filter


Calculations & Observations


The Transfer function for the circuit is :


Fig.1 Shows Input signal (Red wave form) and Output (Yellow Waveform).


Fig.2 Shows Input signal (Red wave form) and Output (Yellow Waveform).


Fig.3 Shows Input signal (Red wave form) and Output (Yellow Waveform).


Fig.4 Shows Input signal (Red wave form) and Output (Yellow Waveform).


Fig.5 Shows Input signal (Red wave form) and Output (Yellow Waveform).


Table.1 shows the amplitude and frequency of input and output signal.


Fig.6 Shows Bode Plot Frequency Vs Amplitude.

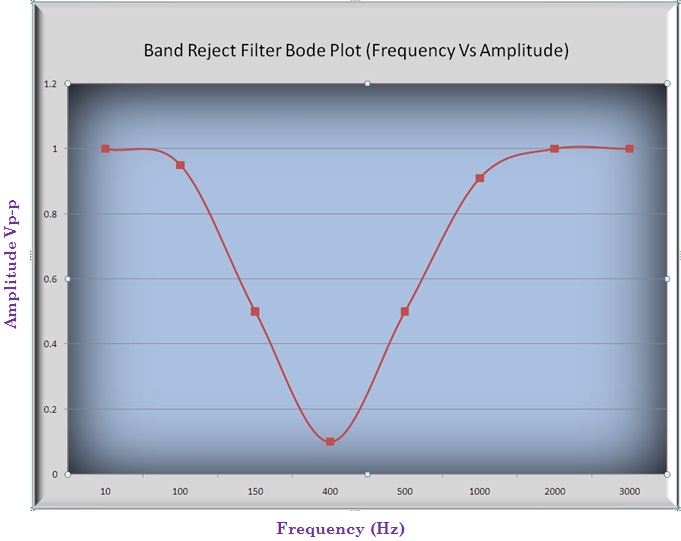
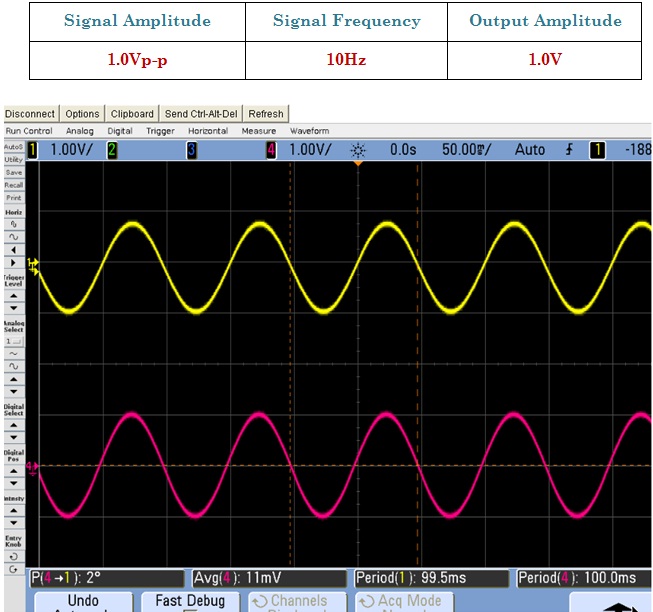
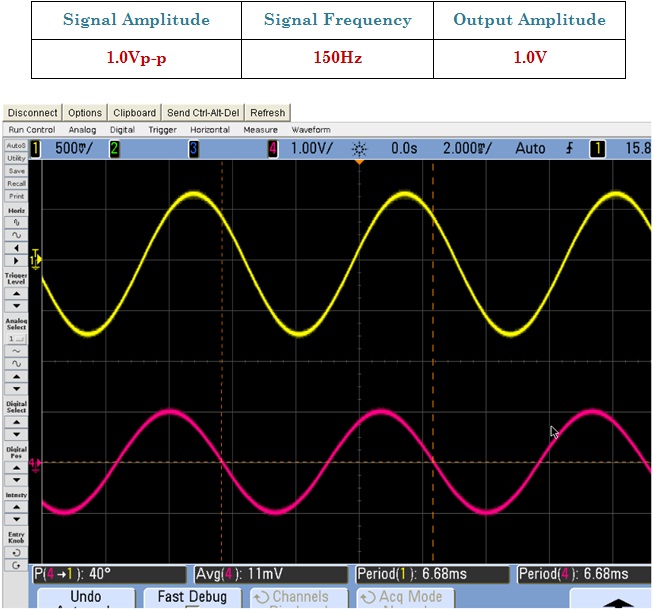
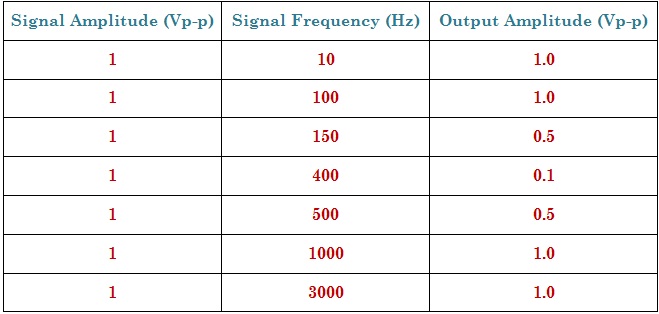
This Bode plot is based on the table 1, which has the value of amplitude and frequency of input and output signal. As the value of input signal frequency will increase; the output amplitude also increases. After certain value of input frequency the output amplitude will not increase and it’ll constant.