 |
 |
 |
 |
 |
 |
 |
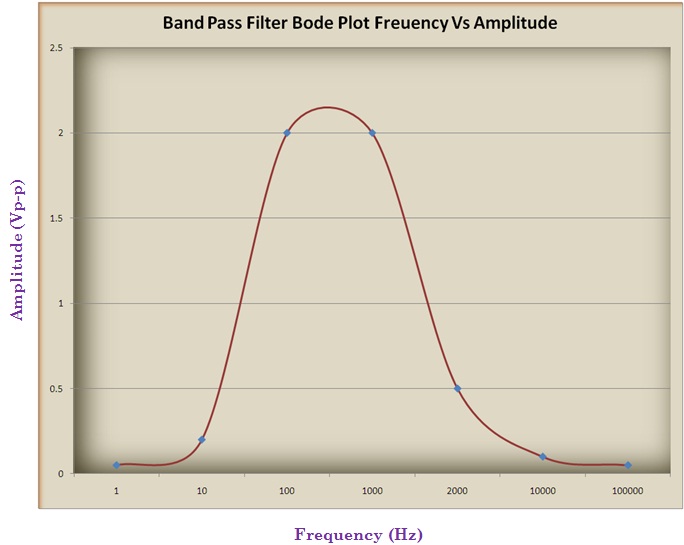 |
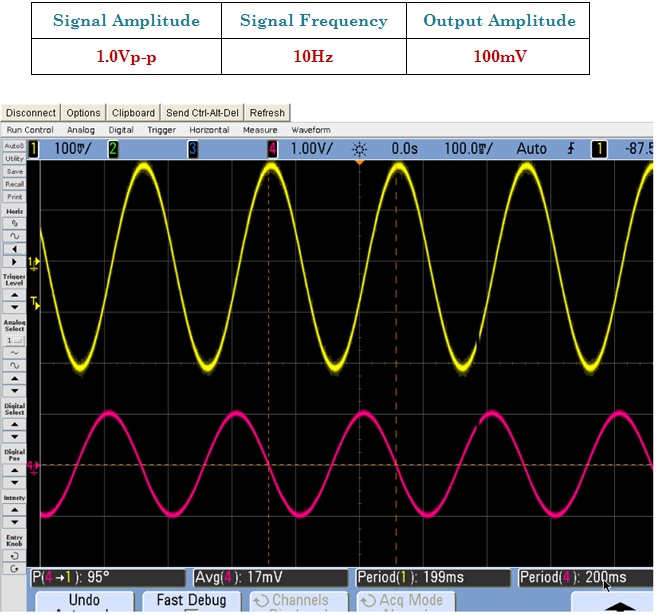
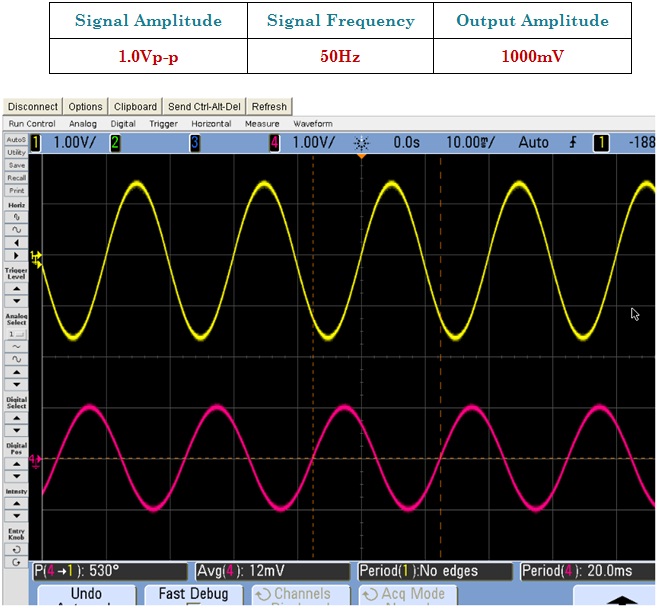
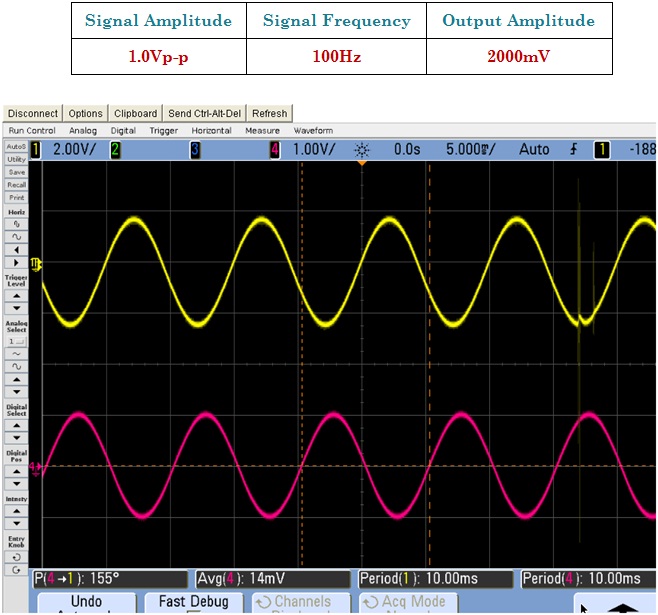
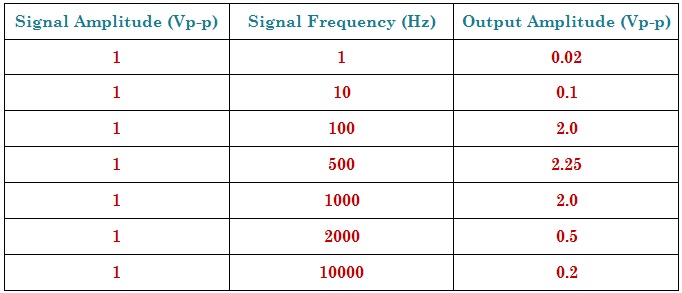
This Bode plot is based on the table 1, which has the value of amplitude and frequency of input and output signal. As the value of input signal frequency varies; the output amplitude also varies. After certain value of input frequency the output amplitude will not change and it’ll constant.