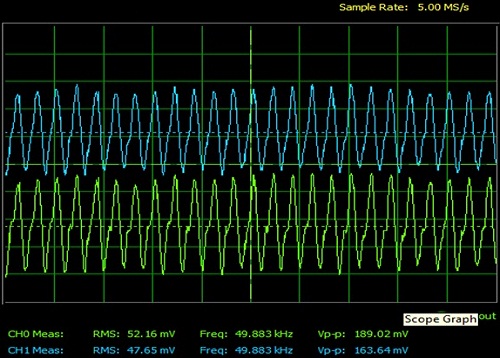
The input & output waveforms can seen in the Fig.1. The green one is o/p signal with SSB-SC as blue signal given to the demodulator & recovered back both the side bands i.e. USB & LSB.
 |
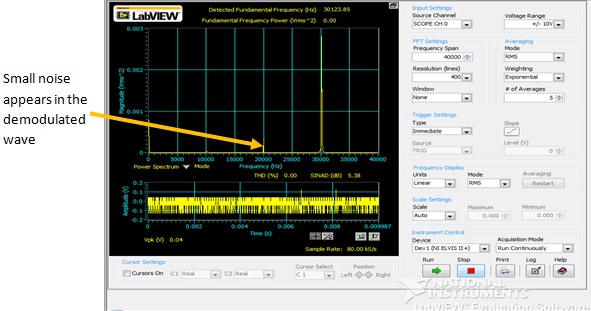
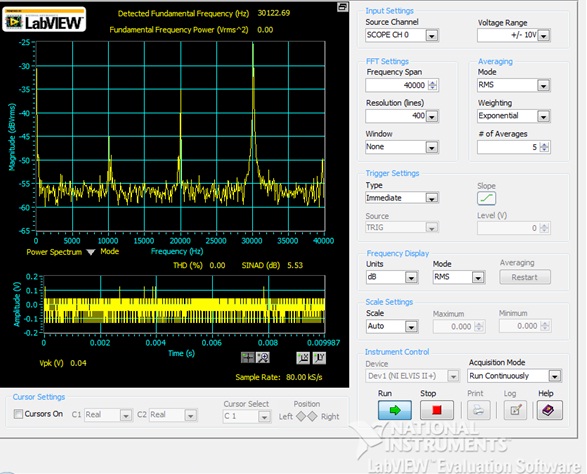
The frequency spectrum (in linear scale) can be found in the DSA Analyzer. It is shown in the Fig.2 below:
 |
 |