 |
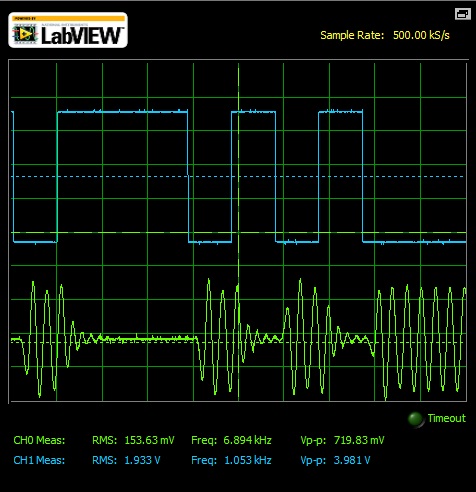
The demodulated FSK signal is shown in the above Fig.1 i.e. the green signal which is obtained using Tuneable LPF.
The logic ‘0’ in the Sequence generator output will lead to higher side of carrier frequency i.e. the mark frequency & the logic ‘1’ will leads to the lower side of the carrier frequency i.e. the space frequency.
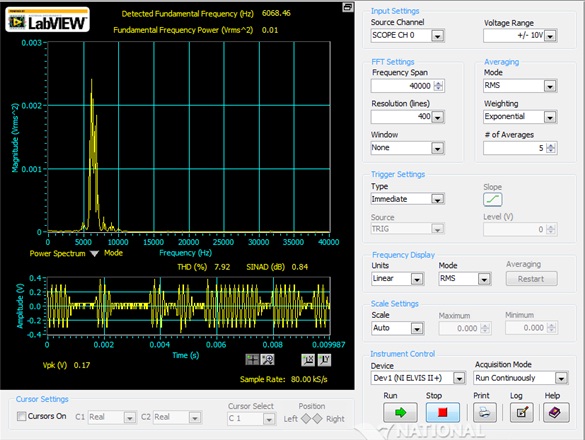 |
In the frequency spectrum of demodulation of FSK signal, the demodulated signal has THD is 7.92 % & SINAD is 0.84 dB. The detected fundamental frequency is 6068.46 Hz & the fundamental Frequency Power is 0.01. So the dominant peak at that detected frequency is shown in the fig.2.
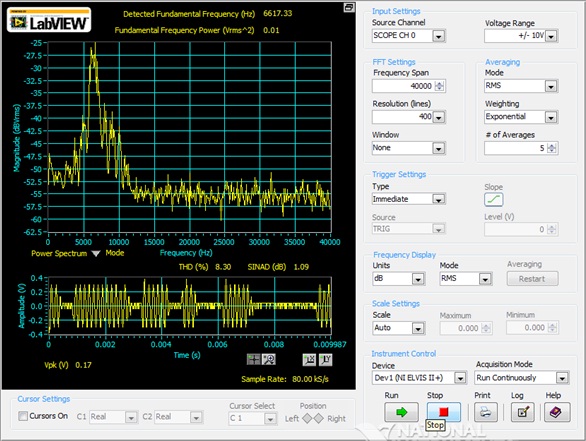 |
The Power spectrum has a THD is 8.30 % & SINAD is 1.09 dB. The detected fundamental frequency is at 6617.23 Hz & the Power corresponding to it is 0.01.