Double - Sideband Suppressed - Carrier (DSB - SC) Modulation


Theory


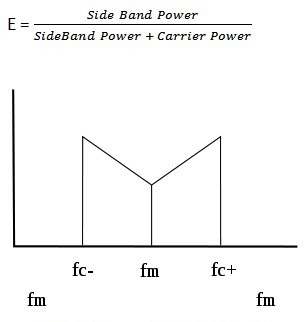
Double-sideband suppressed-carrier Modulation transmission (DSB-SC):

Transmission in which

  • (a) Frequencies produced by amplitude modulation are symmetrically spaced above and below the carrier frequency &
  • (b) The carrier level is reduced to the lowest practical level, ideally completely suppressed.
In the double-sideband suppressed-carrier transmission ( DSB - SC ) modulation, unlike AM, the wave carrier is not transmitted; thus, a great percentage of power that is dedicated to it is distributed between the sidebands, which imply an increase of the cover in DSB-SC, compared to AM, for the same power used.

Spectrum
This is basically an amplitude modulation wave without the carrier therefore reducing power wastage, giving it a 100% efficiency rate. This is an increase compared to normal AM transmission ( DSB ), which has a maximum efficiency of 33.33%, since efficiency is defined as:

The spectrum is shown in the Fig.1.


Fig.1 Spectrum plot of DSB - SC Signal.


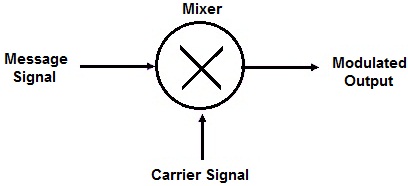
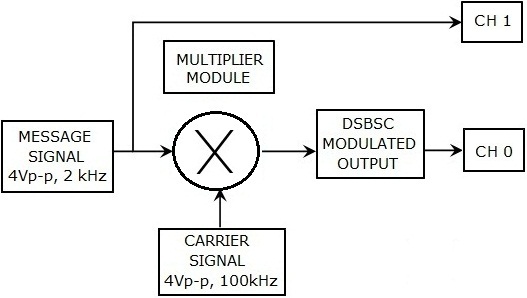
Generation of DSB - SC
If the carrier amplitude is influenced in a multiplier with a message signal without DC offset, an amplitude modulation with suppressed carrier is generated. DSB - SC is generated by a mixer. This consists of a message signal combined with the frequency carrier.


Fig.2 Modulation Process.


Why the term Double Side Band is used?

When m ( t ) is a real signal,

  1. This equation shows that the component at frequency ωC + ω contains exactly the same information as the component at ωC − ω since one can be uniquely determined from the other by taking the complex conjugate.
  2. The portion of the spectrum for | ω | > ωC is called the upper sideband and the portion for | ω | < ωC is called the lower sideband.
  3. The fact that the modulated signal contains both portions of the spectrum explains why the term, double - sideband, is used.
  4. To perform this experiment student need a message signal, a carrier signal and a multiplier for multiplying message signal to carrier signal shown in the Fig.3 below.


    Fig.3 Block diagram representation of this experiment.