 |
 |
 |
 |
 |
 |
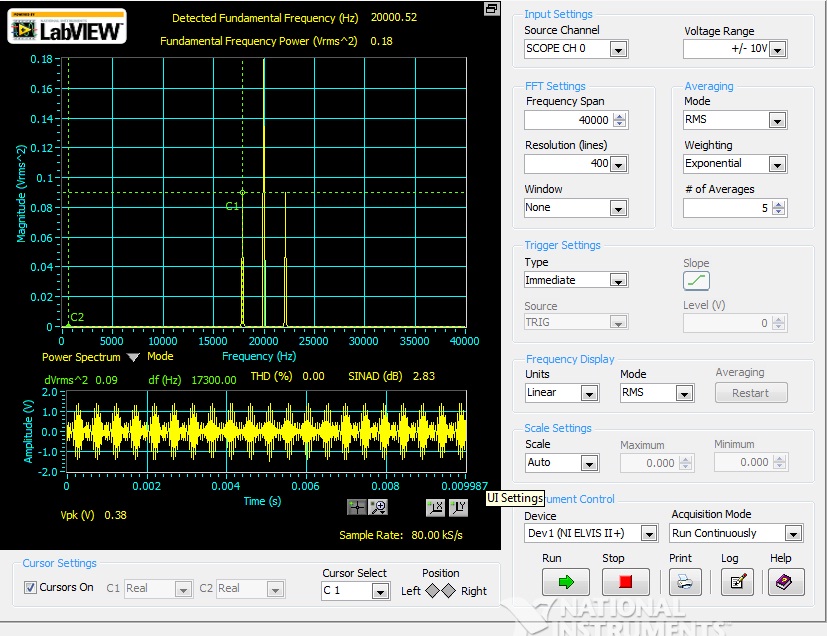 |
In the Fig.6, the Frequency Spectrum of Amplitude Modulated signal has three peaks shown i.e. at 17300 Hz of 44.36 mV, at 19400 Hz of 0.18 & at 21500 Hz of 0.09. The fundamental frequency detected is at 20 kHz with Fundamental Frequency Power is 0.18. The THD is 0% & SINAD of 2.83 dB.
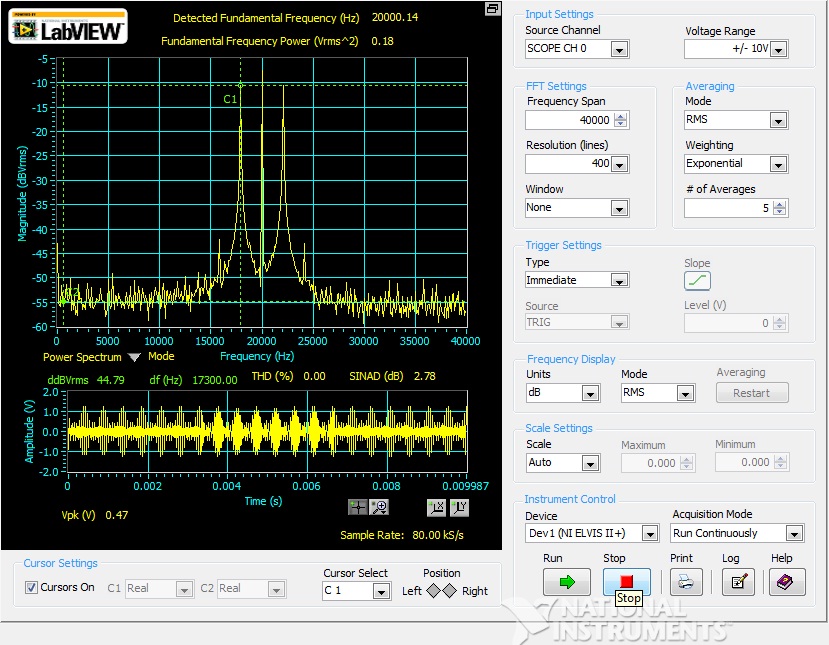 |
The Power Spectrum in dB scale also shows that in Fig.7, that the Frequency Spectrum has three dominant peaks at different frequency with different power component. The THD is 0% & SINAD of 2.78 dB. The fundamental frequency detected is at 20 kHz with Fundamental Frequency Power is 0.18.