Vary the message signal's amplitude up and down a little by turning the Adder module's soft G control left and right a little while watching the demodulated signal.
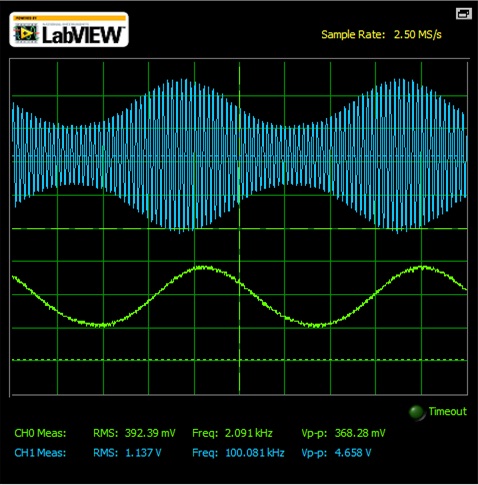 |
The demodulated wave is shown in the Fig.1 i.e. the green one is demodulated wave & the blue one is Amplitude Modulated wave.
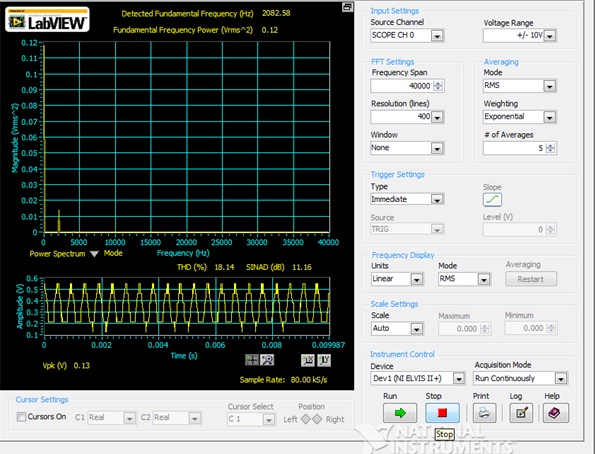 |
In the Fig.2, Frequency spectrum of Amplitude Modulated wave has fundamental frequency component is at 2082.58 Hz with Fundamental Frequency Power component of 0.12. The THD is at 18.14% & a SINAD of 11.16 dB.
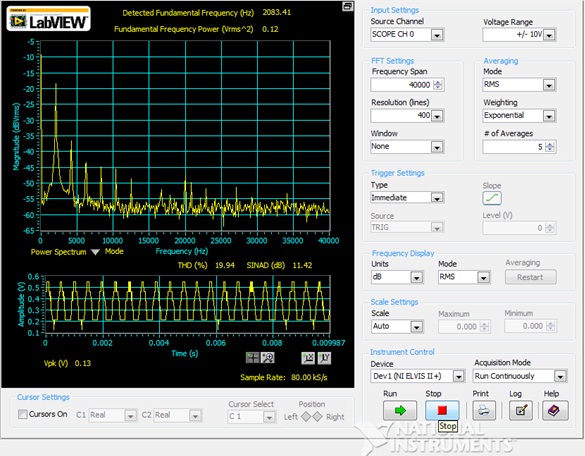 |
The Power Spectrum is shown in the Fig.3 i.e. having a THD of 19.94 % & with SINAD of 11.42 dB. The fundamental frequency detected is at 2083.41 Hz with corresponding Power of 0.12.